
Learning how to query and examine the pg_stat_statements view is critical for those who own the performance of PostgreSQL databases.
Although I’ve dabbled in PostgreSQL (also known as Postgres) since 2002, I’ve only been working with it extensively since 2019. My favorite challenge so far was tuning a sharded 37 TB AWS RDS cluster that ran a flagship feature for a previous employer. It was a very busy system, much like an IOT system, enduring millions of reads/writes and billions of updates and deletes every day. It was so busy, I was only able to investigate and tune from 9 pm to 2 am. At any other time, even the simplest queries wouldn’t even return.
When you embark on a significant tuning effort like the one just described and are tasked with identifying the source of sluggishness, it is invaluable to examine all the unique SQL statements the system has had to process over time and pinpoint where inefficiencies are lurking.
The pg_stat_statements extension is crucial to such an effort. First added in version 8.4, performance monitoring with this extension continues to improve with every release.
You will become invaluable if you learn how to use it well.
Getting Started
Assuming the user/role you are using to connect has the appropriate level of privileges, query your statement monitoring cache:
select * from pg_stat_statements;If this errors out, then either you don’t have the right privileges, or it still needs to be installed by your DBA (which might be you).
First, check that it is included in the preloaded libraries. Honestly, pg_stat_statements should be installed by default. It should not be optional.
You can query your settings with
select name, value from pg_settings where name = 'shared_preload_libraries';If the value of shared_preload_libraries is missing pg_stat_statements, it can be added by altering the system and then restarting the cluster:
SQL> alter system set shared_preload_libraries = 'pg_stat_statements'; -- be sure to retain any other libraries that were previously present in this comma-separated string of librariessudo systemctl restart postgresqlAlternatively, you can open your postgres.conf file and look for the line that starts with shared_preload_libraries. It should be followed by a string that includes pg_stat_statements.
If it is not there, you will have to add pg_stat_statements to that value, or if there are other preloaded libraries already listed, add a comma and pg_stat_statements at the end of the value. If you had to alter postgres.conf, restart the cluster using the same command as above (or whatever widget your cloud provider uses to restart the cluster).
If the preloaded libraries include pg_stat_statements, it can finally be enabled.
create extension pg_stat_statements;This will create the pg_stat_statements view. On Postgres v14+, it will create the pg_stat_statements_info view. A handful of columns were renamed in version 13. The examples below were written for version 14. If the statements below do not run on your system, your version is 12 or below; just remove the word “exec” from total_exec_time, min_exec_time, max_exec_time, mean_exec_time, and stddev_exec_time. Read the official Postgres doc for the view linked above to get a better understanding of each column in the view.
There are a handful of Postgres parameters that pertain to statement tracking. I like to reveal their values using this query:
select name, setting, unit, min_val, max_val, source, vartype, enumvals, boot_val
  from pg_settings
 where name like 'pg_stat%' or name in ('track_io_timing','track_activity_query_size');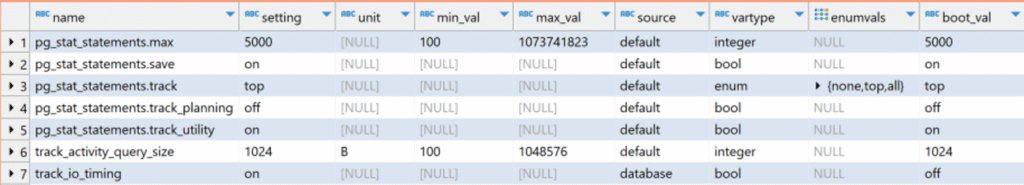
The default settings are typically good enough. However, if your queries are quite large, you might want to set track_activity_query_size to 2048 or 4096. Multi-page queries might require even more bytes to accommodate the whole thing. Also, if you find that blk_read_time and blk_write_time columns are blank for your statements, this means that the track_io_timing parameter is off. You can turn it on for the entire server in the postgres.conf file, or just for the current database, like this:
alter database {mydbname} set track_io_timing = on;Note: It does consume some resources to track I/O. You may wish to turn it back off once your heaviest disk-intensive loads have been identified and corrected.
I’d like to introduce you to a handful of queries that I picked up here and there during years of tuning, which I find handy for quickly identifying sore spots that need attention.
Top SQL Consumers: CPU Time
Below you will see my favorite query for working with tracked statements. It is multi-purpose. You can add WHERE predicates if you wish, or partial query strings to filter the results to just a query or two you are looking for, or switch out the column(s) being ordered by to change the focus of the query. But this query is the one I use the most, exposing the biggest consumers of time (and therefore resources) on the system.
with stmts as (
   select query
        , round((total_exec_time/1000/60/60)::numeric, 2) as total_hours
        , round((100 * total_exec_time / sum(total_exec_time::numeric) OVER ())::numeric, 2) AS pct_of_total_hours
        , calls
        , rows
        , (round(blk_read_time::numeric,0))/1000 blk_read_seconds
        , (round(blk_write_time::numeric,0))/1000 as blk_write_seconds
        , (blk_read_time+blk_write_time)/calls as physical_io_per_call_ms
        , round(min_exec_time::numeric, 2) as min_call_ms
        , round(max_exec_time::numeric, 2) as max_call_ms
        , round(mean_exec_time::numeric, 2) as mean_call_ms
        , temp_blks_read
        , temp_blks_written
     from pg_stat_statements
    where dbid = (select oid from pg_database where datname = 'postgres') -- use your database name here to replace the default "postgres"
)
select *
  from stmts
 where 1=1
   --and query like '%:partial_query_string%'
order by total_hours desc, calls desc;Be sure to replace the name of your database of interest in line 16 if yours is using a name other than the default of “postgres”.
If I already know the statement I’m looking for, or a table name or keyword found in that statement, I can comment in the filter query like ‘%:partial_query_string%’ and re-run to find only those statements matching my string. You can get fancier with regular expresBelow you will see my favorite query for working with tracked statements. It is multi-purpose. You can add WHERE predicates if you wish, or partial query strings to filter the results to just a query or two you are looking for, or switch out the column(s) being ordered by to change the focus of the query. But this one is the one I use the most, bubbling to the top the biggest consumers of time (and therefore resources) on the system.sions as well.
You may find yourself working on a system where each of the thousands of unique statements only differs by a few characters. In order to reduce the noise, you could truncate the query down to 40 or 50 of the first characters and group the measurements by that.
-- bucket statements by simple truncation
with stmts as (
   select query
        , round((total_exec_time/1000/60/60)::numeric, 2) as total_hours
        , round((100 * total_exec_time / sum(total_exec_time::numeric) OVER ())::numeric, 2) AS pct_of_total_hours
        , calls
        , rows
        , (round(blk_read_time::numeric,0))/1000 blk_read_seconds
        , (round(blk_write_time::numeric,0))/1000 as blk_write_seconds
        , (blk_read_time+blk_write_time)/calls as physical_io_per_call_ms
        , round(mean_exec_time::numeric, 2) as mean_call_ms
        , temp_blks_read
        , temp_blks_written
     from pg_stat_statements
    where dbid = (select oid from pg_database where datname = 'postgres') -- use your database name here to replace the default "postgres"
)
select substring(query,1,50) as query_first_50chars, sum(total_hours) as hours, sum(pct_of_total_hours) as pct
     , sum(calls) as calls, sum(rows) as rows, round(avg(mean_call_ms),2) as mean_call_ms
     , sum(temp_blks_read) as temp_blks_read, sum(temp_blks_written) temp_blks_written
  from stmts
 group by query_first_50chars
order by hours desc, calls desc;This aggregation may show the primary culprit, occupying 40, 50 or 70% of the total time for all statements. From there, you can jump back to using the first query above to zero in on the individual statements (using the partial_query_string version to find all statements sharing the same signature as found in the grouped version below), which are causing the majority of the load on the database.
There are times in your tuning efforts when one query is so horrendous that it is consuming most of the resources, or takes so much time to complete, that it skews the results.
This will usually stand out like a beacon, seen by a gigantic difference between min and max execution time, and a large standard deviation. In the example below, ordered by total time, the queries behind rows 3 and 4 have a really huge stddev. Their minimum execution time is .02ms, and average is 19s and 8s respectively, but look at the maximum! 105 hours and 51 hours to execute!
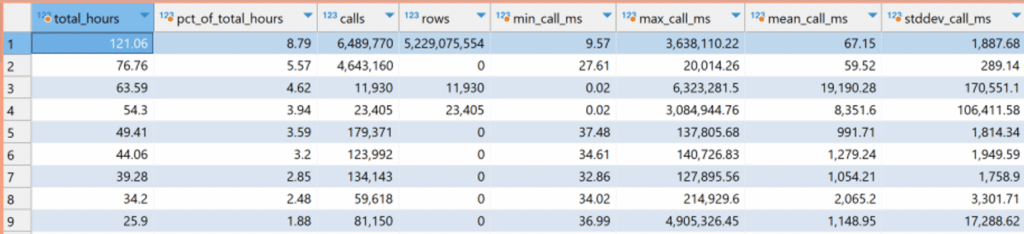
If those queries took days to run every time, that would be the first thing you’d fix. But they don’t. Here’s where you dig a little deeper and exercise judgment. Pursuing queries with a large max time or stddev could be a waste of your time. There might have been one anomalous incident where resources were locked, preventing the statements from completing. Steps should definitely be taken to log and alert when queries take this long in the future instead of hanging indefinitely. But if this only happened once or twice, this is a distraction. In fact, queries 3 and 4 aren’t executed much at all compared to queries 1 and 2, and might have even stopped being used. Perhaps they were only used during the initial migration. The mean tells us queries 3 and 4 are not too bad IF the queries aren’t for an OLTP system. Indeed, these queries (that I can’t show to protect my client) are part of a backend data pipeline system that does large load and deletion operations, so 8s to 19s is OK. It is for reasons like these that I’ll glance over stddev, but I get more value by focusing on total time consumed by the query.
I don’t have an example to show at the moment, but imagine that query 1 in the screenshot above took a mean time of 1 second to return. That seems pretty good if this were a query supporting a UI screen. But it is not. It was called over six million times in the week-long period where these stats were gathered. A one-second response time for a query called millions of times could break the business or bring the system to its knees. Luckily, the top two statements both take less than 100ms and aren’t a concern (the second query is a stored procedure, and postgres doesn’t appear to log rows affected by stored routines, otherwise the rows column could be informative).
Top SQL: Slow Queries
This should be the first or second thing you check when determining the health of an application database, especially one that supports an OLTP service where every millisecond counts. Just change the ORDER BY to see the slowest queries on average:
with stmts as (
   select query
        , round((total_exec_time/1000/60/60)::numeric, 2) as total_hours
        , round((100 * total_exec_time / sum(total_exec_time::numeric) OVER ())::numeric, 2) AS pct_of_total_hours
        , calls
        , rows
        , (round(blk_read_time::numeric,0))/1000 blk_read_seconds
        , (round(blk_write_time::numeric,0))/1000 as blk_write_seconds
        , (blk_read_time+blk_write_time)/calls as physical_io_per_call_ms
        , round(min_exec_time::numeric, 2) as min_call_ms
        , round(max_exec_time::numeric, 2) as max_call_ms
        , round(mean_exec_time::numeric, 2) as mean_call_ms
        , temp_blks_read
        , temp_blks_written
     from pg_stat_statements
    where dbid = (select oid from pg_database where datname = 'postgres') -- use your database name here to replace the default "postgres"
)
select *
  from stmts
 where 1=1
   --and query like '%:partial_query_string%'
order by mean_call_ms desc, calls desc;A few tips I’ve learned over the years. If the query is near the top in consumption of total CPU time AND it is one of the slowest queries, you have yourself a winner that needs research and tuning. A large average execution time doesn’t always mean it has to be tuned. Look at the number of calls. Has the database been running for weeks and months but the query has only been called a few times? The engineers who own the application will know for sure, but it’s likely that query was only used during initial table population or a one-off migration operation. If the query has been called tens of thousands or millions of times, and it is one of the slowest, then it is likely the SQL is poorly written, or there is a missing index that needs to be added.
This is where tuning gets fun, and reminds you of the excitement you experienced in grade school reading mystery novels! You get to be a detective, determining which queries are true problems and what the root cause is of their sluggishness.
Top SQL Consumers: Temp Space
One indication of a wasteful query, or a work_mem setting that is too small, is a large use of temp space because there wasn’t enough work_mem in the session to handle the sort operations. Use this query to identify those types of statements:
with stmts as (
   select query
        , round((total_exec_time/1000/60/60)::numeric, 2) as total_hours
        , round((100 * total_exec_time / sum(total_exec_time::numeric) OVER ())::numeric, 2) AS pct_of_total_hours
        , calls
        , rows
        , (round(blk_read_time::numeric,0))/1000 blk_read_seconds
        , (round(blk_write_time::numeric,0))/1000 as blk_write_seconds
        , (blk_read_time+blk_write_time)/calls as physical_io_per_call_ms
        , round(min_exec_time::numeric, 2) as min_call_ms
        , round(max_exec_time::numeric, 2) as max_call_ms
        , round(mean_exec_time::numeric, 2) as mean_call_ms
        , round(stddev_exec_time::numeric, 2) as stddev_call_ms
        --, shared_blks_hit, shared_blks_read, shared_blks_dirtied, shared_blks_written
        , temp_blks_read
        , temp_blks_written
     from pg_stat_statements
    where dbid = (select oid from pg_database where datname = 'postgres') -- use your database name here to replace the default "postgres"
)
select *
  from stmts
order by (temp_blks_read + temp_blks_written) desc, calls desc;Having identified the queries that use the most temp space, you now need to know the business context behind these queries.
Many top users of temp space will be large INSERT, CREATE INDEX, DELETE, and other bulk operations that happen infrequently. These require lots of in-memory work that spill over to temp and probably don’t need tuning. However, if you find a big, bloated SELECT query that is taking minutes to run and utilizing temp space, then it probably requires your attention and tuning.
Top SQL Consumers: I/O
In some circumstances, you may be more concerned about queries that have to spend inordinate effort reading from or writing to disk. To highlight these operations, just take the same query above, but order by physical_io_per_call_ms DESC.
with stmts as (
   select query
        , round((total_exec_time/1000/60/60)::numeric, 2) as total_hours
        , round((100 * total_exec_time / sum(total_exec_time::numeric) OVER ())::numeric, 2) AS pct_of_total_hours
        , calls
        , rows
        , (round(blk_read_time::numeric,0))/1000 blk_read_seconds
        , (round(blk_write_time::numeric,0))/1000 as blk_write_seconds
        , (blk_read_time+blk_write_time)/calls as physical_io_per_call_ms
        , round(min_exec_time::numeric, 2) as min_call_ms
        , round(max_exec_time::numeric, 2) as max_call_ms
        , round(mean_exec_time::numeric, 2) as mean_call_ms
        , round(stddev_exec_time::numeric, 2) as stddev_call_ms
        --, shared_blks_hit, shared_blks_read, shared_blks_dirtied, shared_blks_written
        , temp_blks_read
        , temp_blks_written
     from pg_stat_statements
    where dbid = (select oid from pg_database where datname = 'postgres') -- use your database name here to replace the default "postgres"
)
select *
  from stmts
order by physical_io_per_call_ms desc;Tips
- Create a new schema in the database named monitor to hold any tables or views you may create to watch and learn the database’s behavior over time.
- Create a weekly job, orchestrated by cron or pg_cron, which saves a snapshot of everything in pg_stat_statements to a local table in the monitor schema.
- If you intend to use the
pg_stat_statements_reset()function to reset statement stats for the database, a user, or a query, save a copy of the pg_stat_statements data for that query, user, or entire database BEFORE you make your change, then reset and re-test. Compare the before and after values to prove performance has improved. - pg_stat_statements is only useful for successful, completed DML and DDL. To see queries currently being executed (useful when a query isn’t returning and you’d like to know what it is doing) query pg_stat_activity instead (subject of future blog post).
Conclusion
It isn’t enough to query pg_stat_statements and look for big time hogs. That’s a great first step and may very well net you some “low-hanging fruit” and quick wins. But you could also spin your wheels and tune the wrong thing.
Knowing the business, knowing the app or service context where the query is used, asking the right questions, figuring out what the query should be doing, how much data should be processed at each step in the query plan, and the order in which the data should be joining and sorting… this is all part of being a good performance tuner. “Know thy data” is the first principle I teach in my classes on data design and performance tuning. This helps you quickly zero in on true waste of resources, ignoring the fluff and noise, and is how you earn your living as a rock star data engineer.
Now that I’m writing again, I’d like to encourage you to subscribe to the blog for future posts. Feel free to contact me if you have questions or a desire to engage. If you have any clarifications or find a technical error, please leave a comment on this post.